


HR and Training Analytics is an optional add on module for SDMS V Staff Development for Windows. The need to analyse large sets of training and HR Data in flexible ways without the need for traditional report writers is ever increasing. This Module provides a complete view of the most important information on your workforce and the training, skills and qualifications they hold. Designed to be both flexible and highly visual, the Analytics Tool allow users to focus on the most significant performance aspects of the workforce and training delivery allowing quick and easy monitoring of such data to support follow up and action by training managers. |
|||||||||||||||
| Management Information Reports and Analysis | |||||||||||||||
Often the most complex and time consuming role of a training administrator is producing periodic Management Information statistics from the data held within the Training Management System. We are often approached by companies and individuals that are looking for a way to produce these reports quickly and easily. Does this sound familiar? Perhaps you are currently using a whole range of reports with different customisations and doing further analysis in Excel?
To help with the production of these Analysis style reports, SDMS has developed its HR and Training Analytics Tool for SDMS V Staff Development for Windows. |
The following areas available from the HR and Training Analytics Tool are:
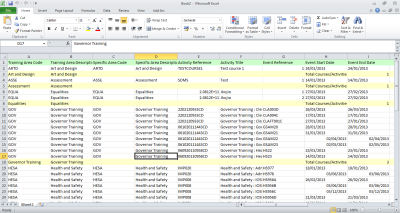
Breakdown Choices, Views & Charts Each of the Reports produced by the Analytics Tool can be exported to Excel, Word and the SDMS Report Viewer & Editor and can be produced as a Summary Count of Information, or a detailed list view of information. Alternatively, you can use the Export All Records feature to export all the data into Excel in raw format where you can do your own counts and analysis etc.
|
||||||||||||||
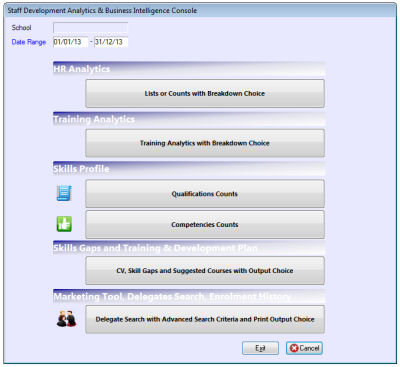
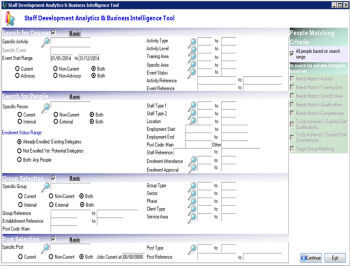
Staff Development Analytics & Business Intelligence Console |
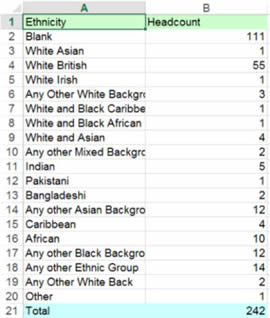
HR Analytics Summary Count of Staff by Ethnicity |
||||||||||||||
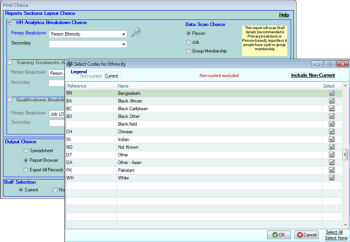
For each type of report, a primary and secondary (optional) breakdown can be selected e.g. a HR Analytics Breakdown by Staff Type & Ethnicity. By using different primary and secondary breakdowns, you can achieve different combinations of reports that would usually take the running of several reports in SDMS. Charts and Graphs can be automatically produced at the same time to present the data visually for a report with a single breakdown. Groups and Date Range Before Running the Reports, a date range can be set so that you can report on a particular period of time e.g. Budget Period, Last 12 Months, Last Quarter etc. All of the reports can be filtered by a specific Group or Organisational Unit if you are only interested in looking at information on a particular group or department of people. |
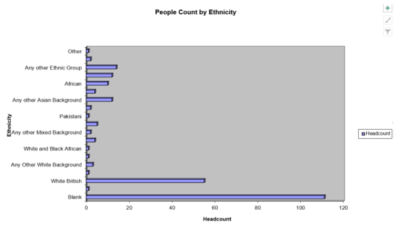
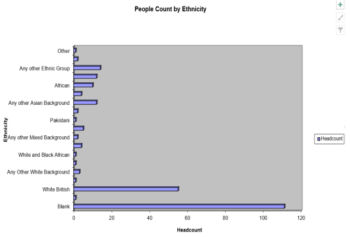
Chart - HR Analytics Summary Count of Staff by Ethnicity |
||||||||||||||
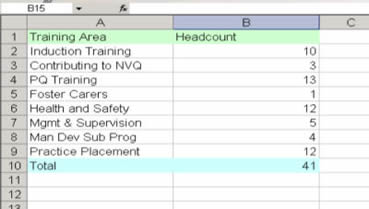
HR Analytics The HR Analytics report reports on the Workforce. This is particularly useful for Headcounts of staff by a particular breakdown e.g. Ethnicity, Gender, Staff Type etc. This will print either a summary count or list (name, job title, main group membership etc.) of people in the system. You can use the Magnifying glass to access the Multi-Pick list to customise and range to print/count only records matching specific codes within the selected breakdown. Using the Data Scan Choice, you can choose what data to scan when producing the staffing counts.
It is recommended you choose the Data Scan matching your primary breakdown field. Training Analytics The Training Analytics Report is broken down into 2 reports:
|
|
||||||||||||||
|
|||||||||||||||
Training Enrolments Analytics The Training Enrolments Report will print either a summary count or list of people trained (so it scans the enrolments file) based on selected breakdowns and you can use the Magnifying glass to range data in specific codes. This report will produce head counts, not enrolment counts, so if a person is enrolled more than one in a selected breakdown, they will only be counted once. This report can be ranged to scan only specific Event Status e.g. Scheduled Courses only, or to get statistics on Cancelled Courses. |
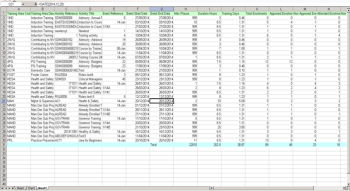
Training Courses Analytics The Training Courses report is especially useful as it gives you a breakdown for each course; of the places available and who did or didn’t attend. This will print either a summary count or list of courses and events within specific breakdowns, with total number of places, total counts of enrolments (not head counts) and total of approved, not approved, attended and not attended within each breakdown, together with total actual costs. This report can be ranged to scan only specific Event Status e.g. Scheduled Courses only, or to get statistics on Cancelled Courses. |
||||||||||||||
|
|
||||||||||||||
Qualifications and Skills Analytics The Qualifications and Skills reports will print either a count or list of staff qualifications/competencies (so it scans the staff qualifications/competencies file) within specific breakdowns, with total number of people (head counts) within each breakdown. Report Outputs: Each report is available in the following outputs:
The summary count gives a summarised count for each different type of breakdown and the list only gives you the raw data in a list so you can see the detail of what has been included in the summary count. |
Automatically Product Chart When exporting to Spreadsheet, you can choose to have the system produce a Chart automatically to display the information visually. You can choose from the following options:
|
||||||||||||||
|
|||||||||||||||
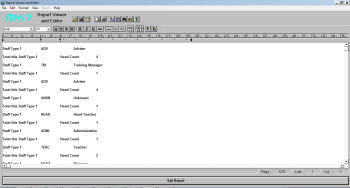
Report Viewer and Editor Output Using the Report Browser output option on any of the reports in the Staff Development Analytics Console, will display the Report in the Report Viewer and Editor. From here you can edit the report contents as you would with any other Report in SDMS V Staff Development for Windows. When choosing the Report Browser Option from the Staff Development Analytics Tool, you will be offered with 3 Options for presenting the report:
|
|
||||||||||||||
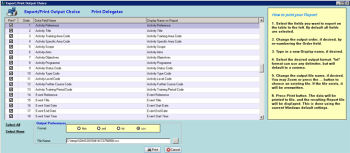
Export All Records - Field Output and Choice Using the Export all Records (Field Output & Choice) output option on any of the reports in the Staff Development Analytics Console, the system allows you to choose which fields you want to print onto your report and then decide how you want to Display the field name on the report including which order you want the fields to be displayed in. Essentially it allows you to design your own reports with the information that you need. This exports all of the raw data into .csv, .txt, html or .xml format allowing you to further edit and analyse the data. |
|
||||||||||||||
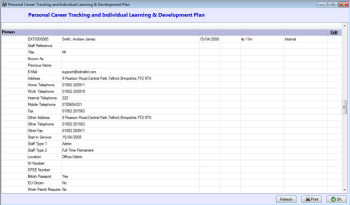
Skills Gaps The CV, Skills Gaps and Suggested Courses with Output Choice option available from the Staff Development Analytics & Business Intelligence Console, has been designed to aid in the process of checking the details in the SDMS V Staff Development for Windows which have been entered via the Web by Staff at Schools, as well as being a general tool for a quick view of a member of staff’s Personal Career History and their Learning and Development. The Print Choices screen allows users to choose which part of the CV they want to print e.g. only Qualifications or Skills Gaps.
The following areas are available for reporting:
|
Marketing Tool The Marketing Tool contains 2 features:
The delegate Search feature provides you with the tools to search for suitable delegates for courses and send targeted emails to them based upon user definable email templates. It allows you to scan for suitable potential candidates for courses based on several key criteria:
It then shows all suitable candidates in a list with an indicator of whether they have a suitable email address to send an email to advertise the course and ask them to book on via the e-Training site. This tool can also be used for Batch emailing anyone in the system, not just for advertising courses.
|
||||||||||||||
|
Not only can you email people from this tool, you can also print the information out into a customisable report. You can choose the fields you want on your report, the order and name of the columns and even the desired output e.g. .csv, .txt, .html or .xml. |
||||||||||||||